Area Estimation for Images with Defined Edges
Measuring the area from an image has a lot of significance in medicine, industry and geography. Some of the applications of this are the detection of cancer cells in humans, quality inspection in electronic manufacture and land area estimation. Finding the area of a regularly shaped object is fairly easy since their formulas are known but irregularly shaped objects are the tricky ones. In reality we encounter irregular shaped objects more than regulary shaped ones. Techniques have been developed to calculate the area of images. Two of these techniques are the Green theorem and morphological operations. Morphological operations is a technique which needs pixel counting in blobs.
I made a square, equilateral triangle and circle using paint. I made the background black for all the shapes.
The images are shown below. I used the Scilab and loaded the SIP toolbox to aid me in calculating the area of the shapes. I used the code below to see if the follow command really gets the edge pixel coordinates of the shape.

 |
| Figure 1. Plot in Scilab of the edge pixel coordinates of the image of the circle below |
 |
| Figure 2. Image of a circle generated using Paint |
 |
| Figure 3. Plot in Scilab of the edge pixel coordinates of the image of the square below |
 |
| Figure 4. Image of a square generated using Paint |
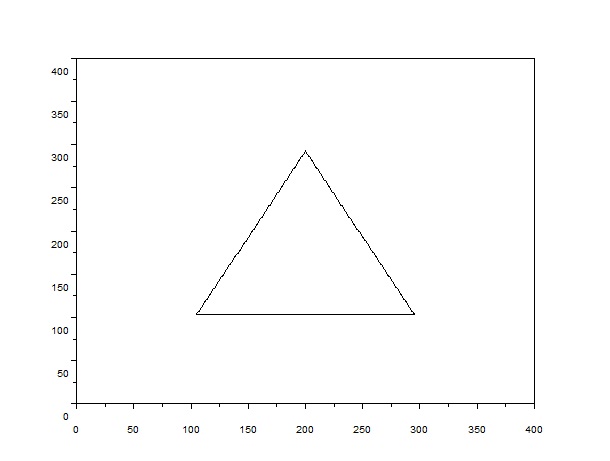 |
| Figure 5. Plot in Scilab of the edge pixel coordinates of the image of the triangle below |
 |
| Figure 6. Image of a triangle generated using Paint |
Here is the code I used for this activity.

Lines 1 to 3 were used to get the pixel coordinate of the edge of the shapes. Lines 4 to 10 were used to calculate the area of the image using the Green’s theorem. Lines 11 to 14 were used to find the accuracy of the method. Below are the data obtained for the three shapes:
| Shape | Calculated Value | Analytic Value | Accuracy |
| Triangle | 18038.5 | 18324 | 98.441934 |
| Circle | 29675 | 30004 | 98.90348 |
| Square | 37681.5 | 38220 | 98.591052 |
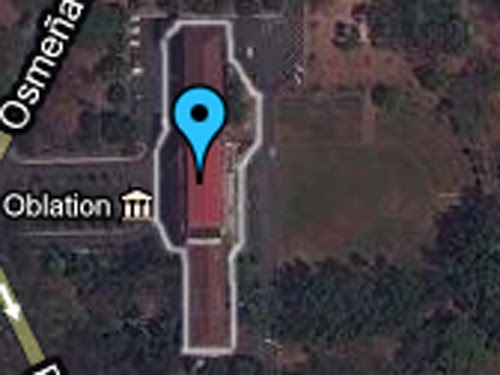
 |
| Figure 7. Image of the Quezon Hall in google map |
 |
| Figure 8. Image of the Quezon Hall masked in Adobe Photoshop |
 |
| Figure 9. The Background of the area was set to black |
 |
| Figure 10. Plot in Scilab of the edge pixel coordinates of the image of Quezon Hall |
Area of Quezon Hall
Calculated value = 1976
Analytic value = 2118
Accuracy =
I would give myself a grade of 10 for this activity for being able to do all the requirements and explaining it well. I enjoy learning something new so I enjoyed this activity.
Walang komento:
Mag-post ng isang Komento